Broker perception geographic scorecards: Different states lead in lender advocacy and overall broker satisfaction
Residential mortgage performance varies meaningfully by state. Using the latest Broker Pulse geographic scorecard, this report compares Net Promoter Scores and satisfaction scores across the broker experience journey for NSW/ACT, QLD, VIC/TAS, WA and SA/NT over the last 12 months leading to June 2025. Results highlight clear leaders and gaps in broker sentiment for their mortgage application processes. Broker Pulse is a monthly-run survey that asks residential (and commercial) brokers to share their experiences with the lenders they worked with throughout the month, rating them across turnaround time, credit assessment, BDM interactions, and the overall broker journey.
Key stats you need to know
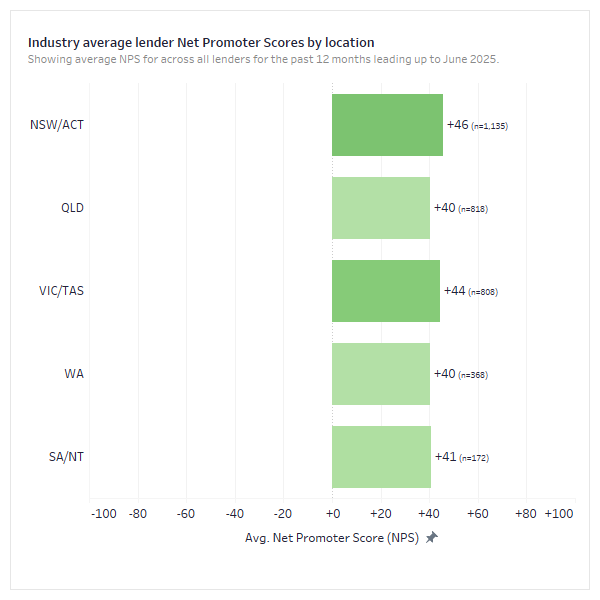
- NSW/ACT posts the highest lender NPS at +46, ahead of VIC/TAS at +44 and SA/NT at +41.
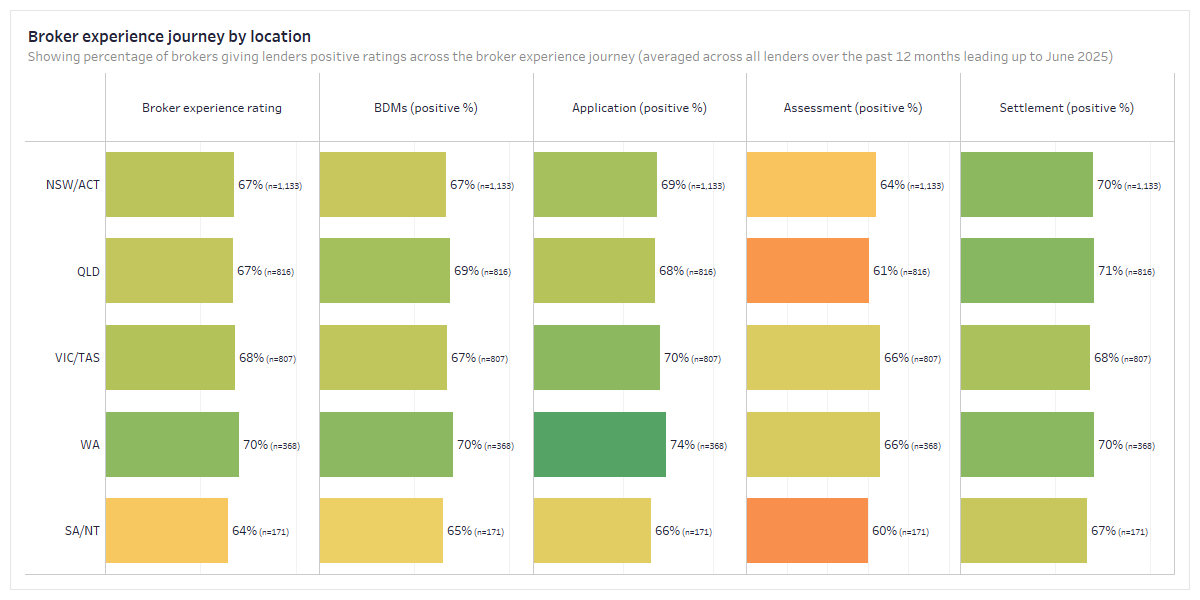
- WA sets the pace on application experience at 74% and leads overall broker experience at 70%.
- Across the mortgage application process, assessment is the weakest stage nationally, only receiving between 60% to 66% satisfaction
Advocacy is strongest in NSW/ACT, with VIC/TAS close behind
- NSW/ACT achieves an average lender NPS of +46 across the past 12 months.
- VIC/TAS records +44, indicating similarly strong advocacy among brokers.
- SA/NT sits at +41, ahead of QLD and WA which both average +40.
- NSW/ACT’s NPS result is supported by the largest respondent base in this cut at n=1,135.
- State‑level NPS dispersion is modest, but the two‑to‑six‑point spread is meaningful in competitive broker markets.
Net Promoter Score is an industry measure used to gauge customer loyalty or advocacy. Looking at broker advocacy by state, higher NPS in NSW/ACT and VIC/TAS suggests more consistent delivery against broker expectations across pricing, policy and process. States clustered around +40 still show broadly positive sentiment, but lenders face a narrower margin for error when issues arise.
“An NPS above +40 means brokers are generally getting good results. The challenge for lenders is to keep that up while fixing weaker areas like credit access and communication, because those issues can quickly reduce broker support,” said Michael Johnson.
WA leads on application, QLD tops settlement
- Overall broker experience is highest in WA at 70% average, ahead of VIC/TAS at 68% and NSW/ACT and QLD at 67%.
- Application stage satisfaction peaks in WA at 74%.
- QLD leads by a hair for settlement at 71% satisfaction, ahead of NSW/ACT and WA at 70%
We asked brokers to rate their experience at every touch point throughout their journey with lending institutions. The broker experience journey begins with communicating with BDMs, to filing loan applications, receiving assessments and ends when the loan is settled. WA has the highest broker experience scores across all points of the journey, while SA/NT received the lowest. In the entire broker experience journey, ‘application’ and ‘settlement’ received the highest overall scores. Settlement experience is strongest in QLD at 71%. BDM satisfaction is highest in WA at 70%.
“Strong settlement scores tell us brokers are getting reliable outcomes once deals reach the finish line. The challenge is keeping that same consistency earlier in the process,” said Michael Johnson.
Assessment remains the weakest stage nationally
- Assessment satisfaction peaks at 66% in VIC/TAS and WA.
- SA/NT reports the lowest satisfaction for the assessment stage at 60%
- SA/NT also has the lowest overall broker experience score at 64%
Assessment scores lag behind other stages in the mortgage application process, peaking at 66% satisfaction in VIC/TAS and WA, and dropping to 60% in SA/NT. SA/NT also posts the lowest overall broker experience rating at 64%. While application and settlement earn the most positive ratings, assessment is the stage most likely to frustrate brokers, with calls for faster decisions and clearer communication from assessors.
“High scores in application and settlement show what’s possible. The assessment stage just needs faster decisions and clearer answers to bring it up to the same standard,” said Michael Johnson.
About Broker Pulse: Residential Lending
Broker Pulse is a monthly survey of residential mortgage lenders conducted by Agile Market Intelligence. It is a community-driven knowledge base of lender performance. Broker Pulse offers transparency to the market by surfacing these collective insights from the broker community. This empowers brokers to make informed decisions and enables lenders to benchmark and improve performance.
Participating brokers receive access to a bird’s-eye view of the lender benchmarking data each month. To sign up or for more information visit https://www.brokerpulse.com.au/
The latest edition (June 2025) of Broker Pulse is based on responses from 282 residential brokers, collected between 1 and 16 July 2025. Brokers were asked to share their experiences with the lenders they worked with throughout June, rating them across turnaround time, credit assessment, BDM interactions, and the overall broker journey.


.svg%402x.png)


_100x30%403x.png)

