Brokers identify access to credit assessors as a key lender weakness
In its 16th annual edition, the 2025 Broker Pulse Third-Party Lending Report, based on a national survey of over 1,000 residential mortgage brokers, shows that while satisfaction with lender speed and support has reached an all-time high, major operational weaknesses persist. A detailed comparison of importance versus performance reveals that credit assessment and product pricing are failing to meet broker expectations, despite being among the most critical decision drivers.
You can download the public report here.
Key stats you need to know
- Credit assessment staff and product pricing are rated highly important but underperform against broker expectations.
- Broker satisfaction with speed rose from 62% in 2021 to 79% in 2025, the highest ever recorded.
- Call centre support, broker websites/portals and post-settlement service remain the lowest performing areas overall.
Pricing, policy, and people drive broker decisions
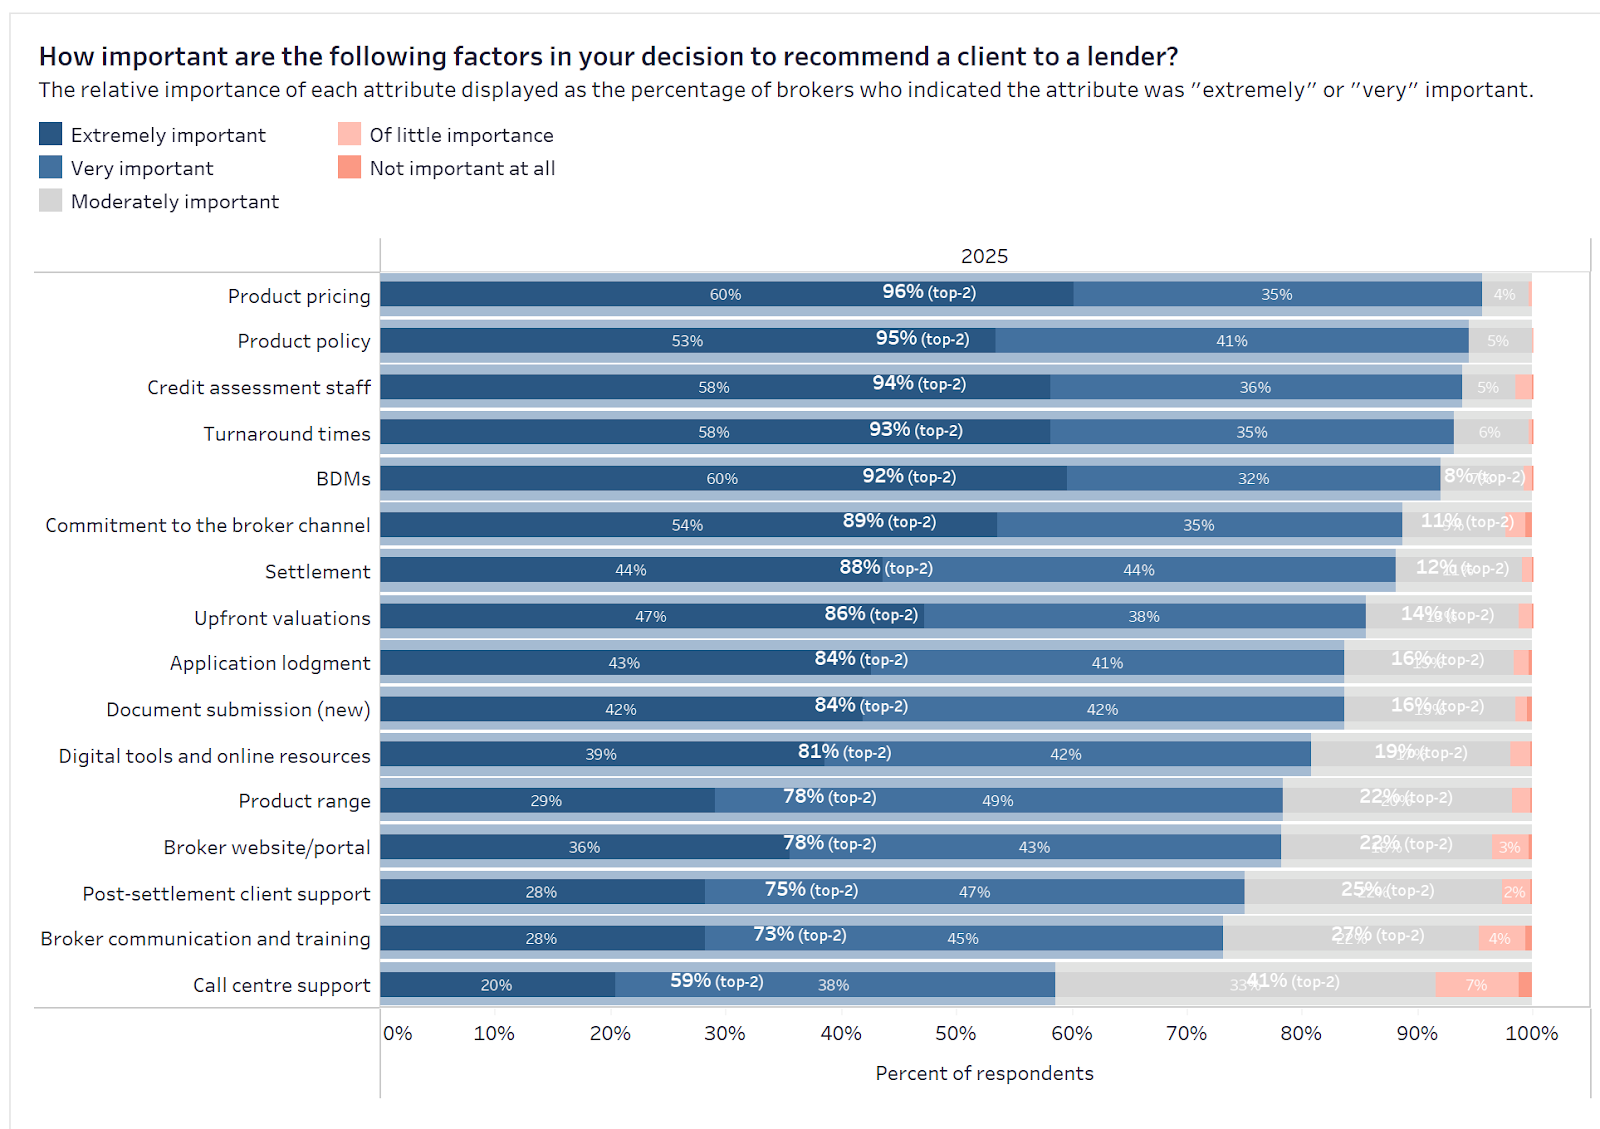
- Product pricing, product policy, and credit assessment staff are the top three decision drivers for brokers, each cited as “extremely” or “very” important by over 94% of respondents.
- Turnaround times and BDM support round out the top five, both rated as top-tier priorities by over 90% of brokers. Settlement, valuations, and application lodgement form the middle tier of importance, scoring between 84% and 88% in top-two importance.
The findings show that brokers continue to prioritise pricing, speed, and the quality of frontline personnel in credit and BDM roles. These five attributes consistently influence deal placement, far more than digital tools, post-settlement service, or contact centres.
“When brokers weigh up where to place a loan, it’s not your website or chatbot that makes the difference, it’s pricing, policy clarity, and whether your credit team can get the deal done,” said Michael Johnson, Director at Agile Market Intelligence.
Brokers say key decision drivers are not being delivered
- Product pricing and credit assessment are both rated above 90% in importance, but their satisfaction scores fall short of satisfaction benchmarks relative to other areas of the process. Broker feedback identifies these areas as frequent deal-breakers, especially in complex or time-sensitive applications.
- BDMs, upfront valuations, settlement processes and clarity of product policies are all key strengths of the lender/broker relationships that are both important and highly rated by brokers surveyed.
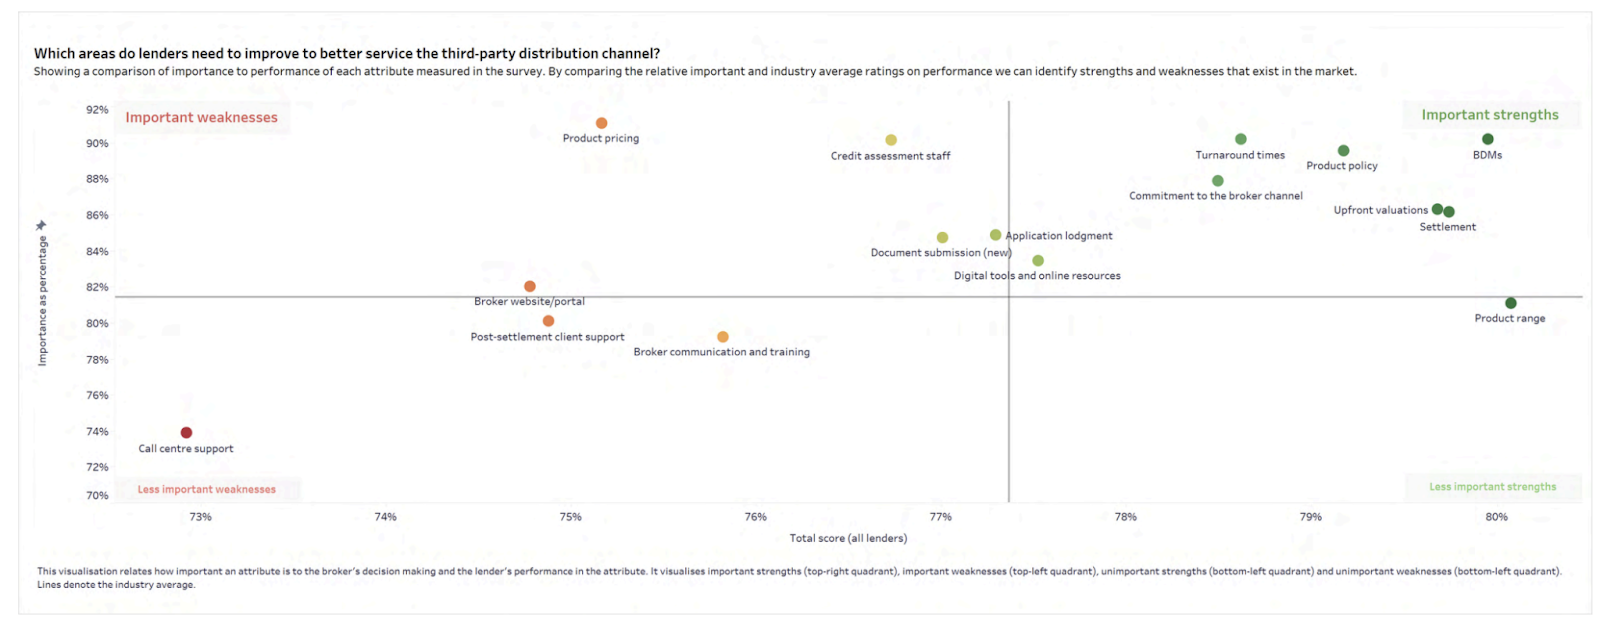
The key drivers analysis compares each service attribute’s importance to brokers against its average performance across all lenders. Plotted on a quadrant chart, it helps identify where lenders are overperforming, underperforming, or misaligned with broker priorities.
Attributes in the top-right quadrant, such as turnaround times, BDM support, and product policy, are both highly valued and well delivered, marking them as industry strengths.
However, the top-left quadrant highlights a critical warning: credit assessment staff and product pricing are rated among the most important factors in lender selection,yet sit below average in performance. This signals a structural weakness in how lenders support complex deal assessments and maintain pricing competitiveness.
Meanwhile, lower-impact attributes like call centre support and post-settlement service fall into the bottom-left quadrant, suggesting limited strategic value. For lenders, the takeaway is clear: executional consistency in credit and pricing is essential to maintain broker trust, and cannot be offset by strengths in other areas.
“A key drivers analysis is used as a roadmap for lenders to evaluate what their relative strengths and weaknesses are so that they can prioritise where they need to focus their efforts to see the greatest uplift in broker satisfaction and therefore, flows.,” said Michael Johnson.
Satisfaction is up, but expectations are rising faster
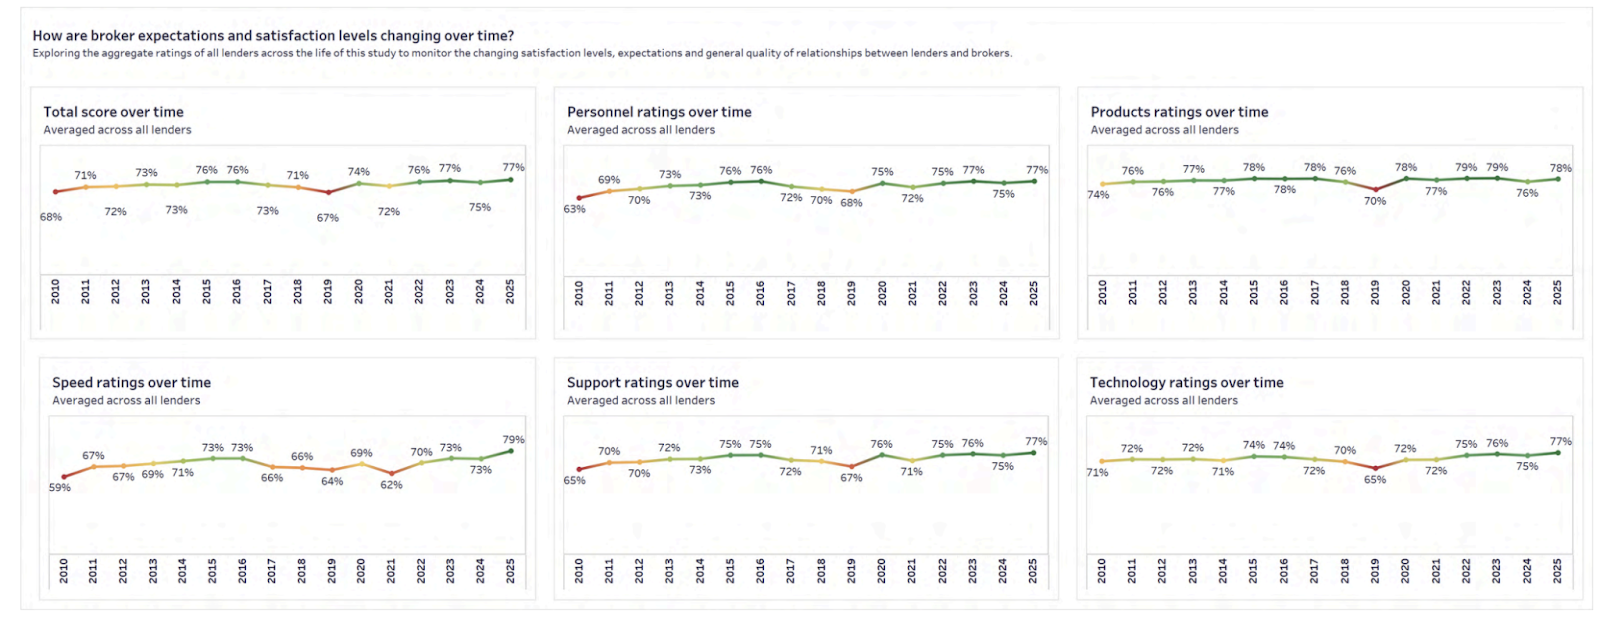
- The average broker satisfaction score reached 77% in 2025, tying the highest recorded level in the last 15 years.
- Speed satisfaction rose 17 points over four years, the fastest improvement across all tracked attributes. Support ratings also increased, hitting 77% in 2025 after steady gains since 2021.
- Technology ratings rose from a post-COVID low of 72% in 2020 to 77% in 2025. Personnel and product satisfaction saw more gradual recovery, both rebounding from pandemic-era dips.
The long-term trend is clear: lenders have made substantial progress in delivering faster turnarounds, better support, and more reliable tech platforms, areas that directly impact broker workflow. With speed and technology now scoring on par with personnel and products, lenders have closed longstanding experience gaps.
“The data tells a strong story, turnaround times and tech experience used to be major liabilities. Now they’re strengths brokers can rely on. However, for lenders who fail to keep up with their peers, they will seem to perform negatively even if they have objectively improved their proposition.” said Michael Johnson.
Reducing complexity and managing expectations a priority for broker satisfaction
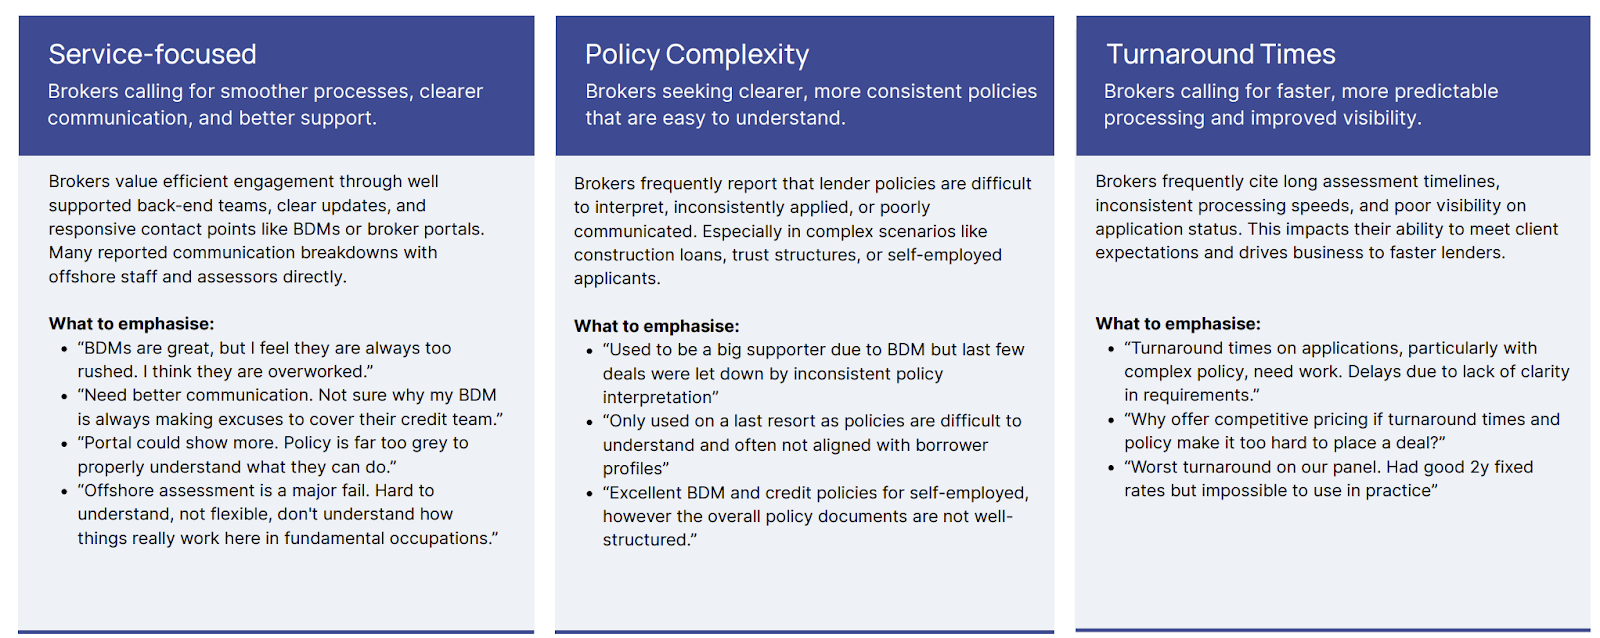
In a qualitative analysis of broker comments submitted in the survey, we found that brokers highlighted the need for smoother processes, clearer policy interpretation, and faster turnaround times. Brokers call on lenders to simplify the lending journey and deliver more consistent, responsive support.
Specifically, there were three themes of feedback:
- Service: Brokers calling for smoother processes, clearer communication and better support.
- Policy: Brokers seeking clearer, more consistent policies that are easier to understand.
- Turnarounds times: Brokers calling for faster, more predictable processing and improved visibility.
About the Broker Pulse Third-Party Lending Report
The 2025 Third-Party Lending Report is based on survey responses from over 1,000 Australian residential mortgage brokers collected between February and May 2025. Each broker rated the lenders they submitted deals to over the previous 12 months across 16 attributes, including products, credit, personnel, support, and technology. Attribute scores are presented as percentages of total possible points and weighted equally. Fieldwork was conducted across a 12-month period, with participants including brokers from all aggregator groups and geographies.
You can download the public report here.


.svg%402x.png)


_100x30%403x.png)

